Exploring A/B Testing Mistakes: a simulation study
A/B testing has become commonplace in the business and tech community. The method allows decision makers to see which version of a product performs better and enables leaders to make evidence-informed decisions. Companies, political campaigns and market research firms often utilize these tests to improve website design, products, and marketing strategies.
Many organizations are already conducting A/B testing. When careful attention to statistical theory is not given, misguided A/B conclusions can in-sue. This white paper uses simulations to illustrate four common errors that can occur in A/B testing:
- Optional Stopping: running the same test until you see a positive result.
- Multiple Comparisons: if there is a negative result, try a different outcome.
- Insignificant “Significant” Results: ignoring effect size.
- Ignoring Interactions: Hidden patters can skew results.
When careful attention is given to the statistical theory that informs A/B testing these problems can be avoided, however, when ignored misguided conclusion can be reached.
Optional stopping
One choice during the A/B process is deciding when data collection should stop and testing should begin. Making quick decisions is valuable, and it is tempting to frequently test the results as data comes in. For instance, you could stop data collection after every 100 users and conduct your analysis; if there is no significant finding, data collection resumes and the process continues until a finding is discovered or the A/B test cycle ends.
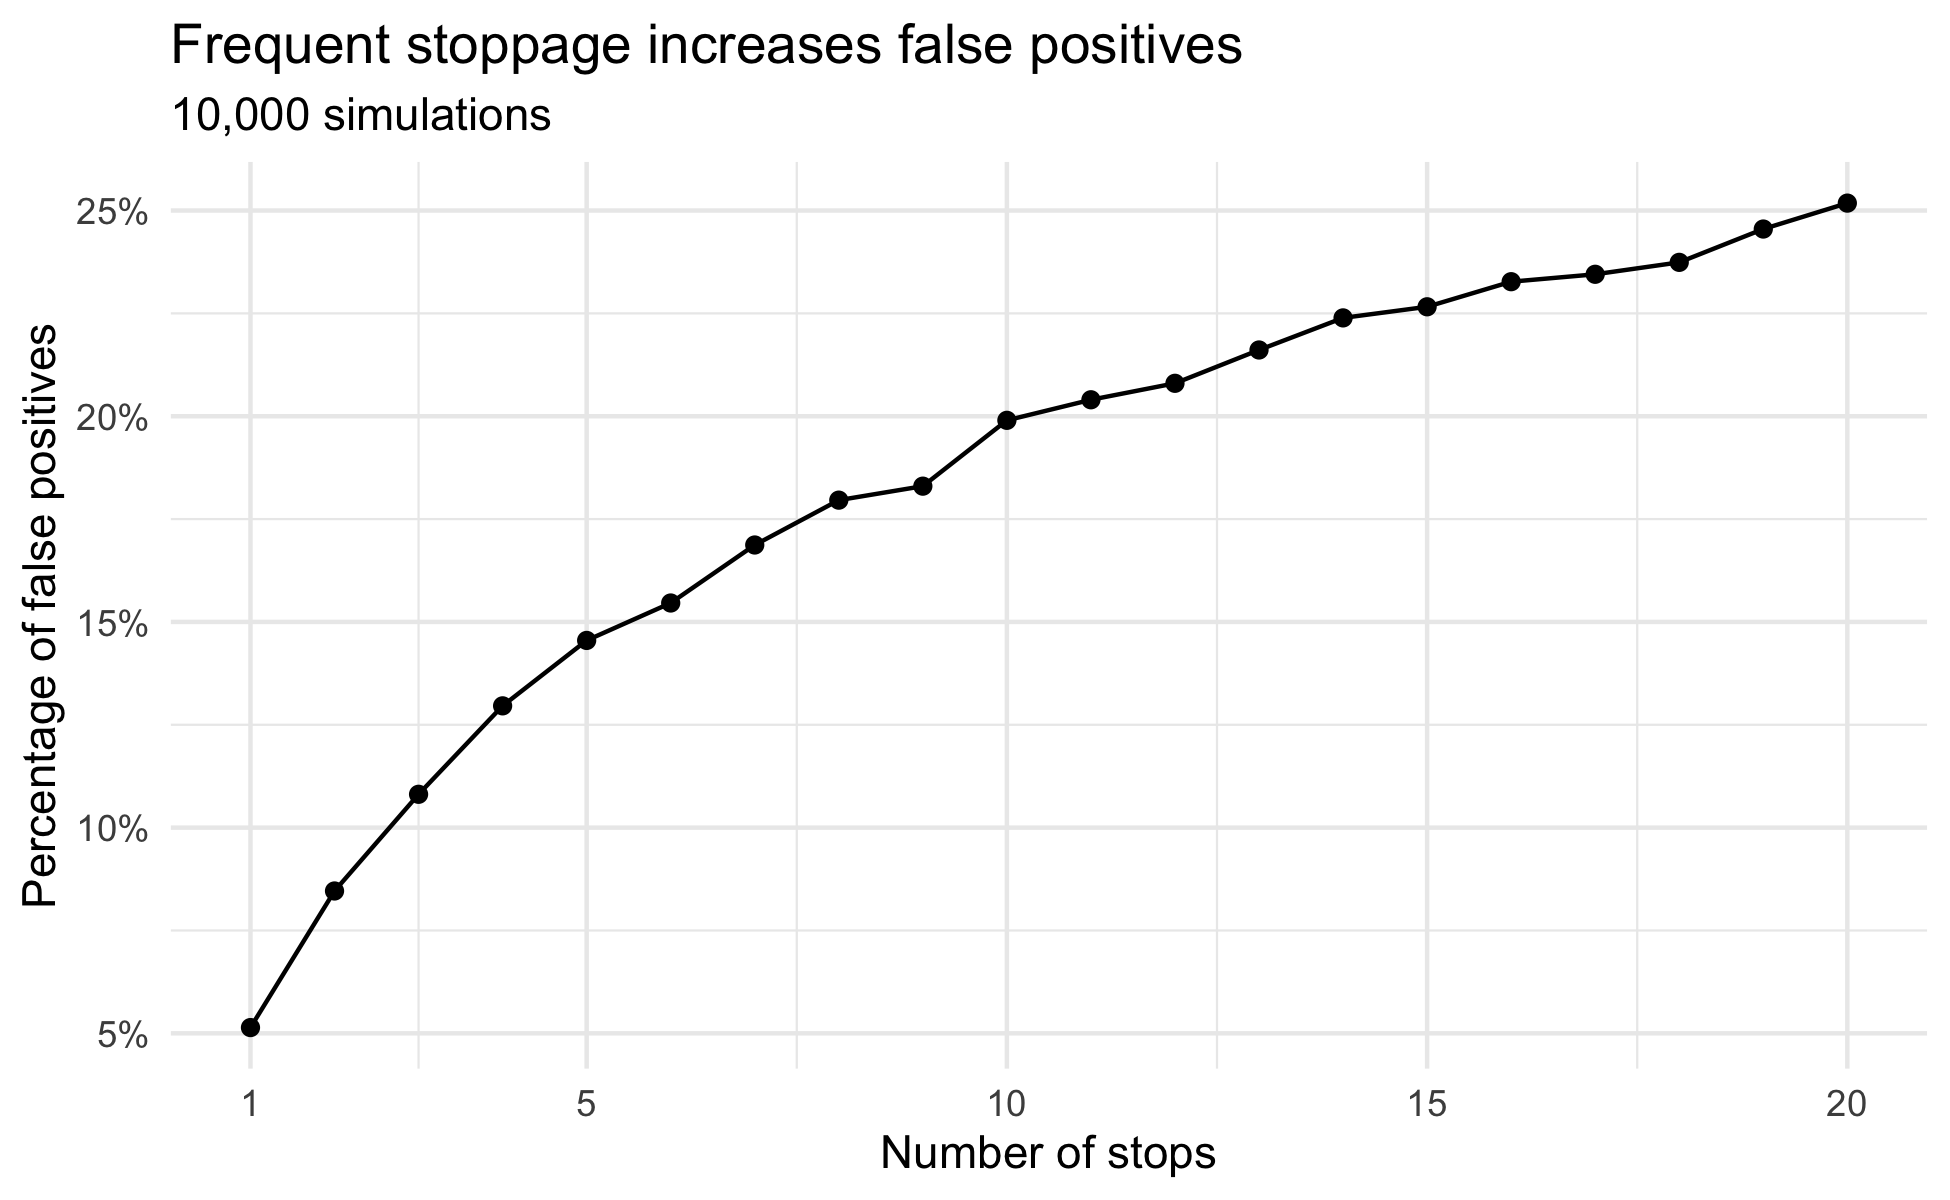
This is a problem. Following A/B test theory, there is a 5% chance that a positive result is a false positive, however, when the number of stops is increased the chance of a false positive also increases. This is illustrated in the following simulation which varies how often testing is conducted within a single A/B cycle. That data was simulated such that there is no difference between A and B, thus, every positive result is a false positive.
The 5% false positive rate is only maintained when there is a single stopping and testing point. With as few as 5 stops the false positive rate rises to about 15%. Shown in the results from the simulation, the rate of false positives only continues to rise as optional stops to conduct a test increase. While frequent stopping to run an analysis may appear a viable means of delivering quick results, this approach drastically increases the risk of reaching a false conclusion.
The Multiple Comparison Problem
A single A/B test cycle can be used to answer many questions: was there a difference in time spent between version A and version B? How about a difference in the number of clicks or likes?
Testing multiple outcomes allows you to get the most out of a single cycle, but careful considerations need to be taken to avoid drastically increasing the false positive rate. This risk increases with each additional outcome and without implementing the correct adjustment, the probability of coming to a false conclusion substantially rises.
The risk of multiple comparisons can be controlled by introducing the Bonferroni correction, which accounts for the additional false positive risk introduced with each additional outcome.
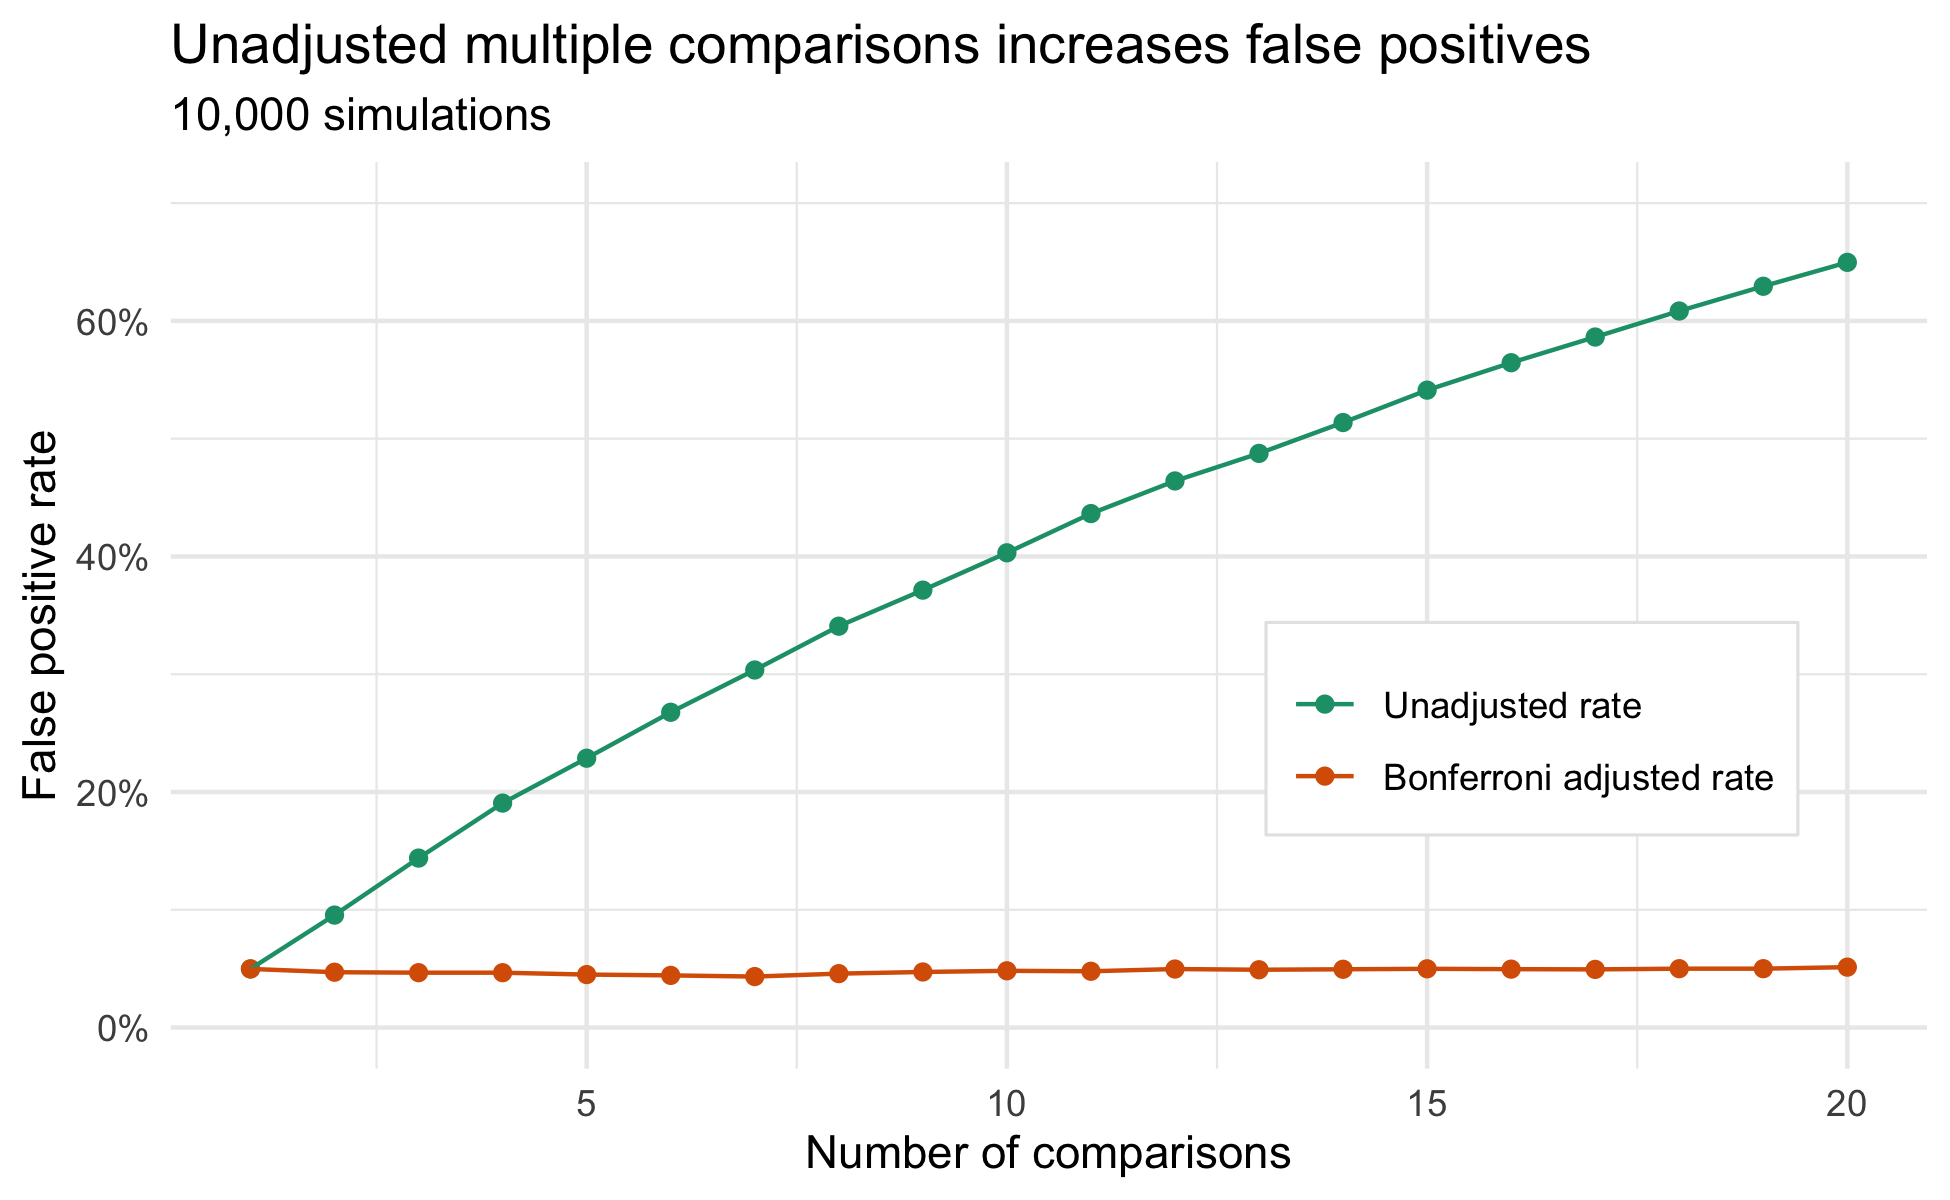
To illustrate the implications of multiple comparisons without implementing the appropriate correction, another series of simulations was used. This time varying the numbers of comparisons replaced varying the number of optional stops. In this simulation, only a single stop was used but the effects of testing multiple different outcomes within a single A/B cycle was explored. Like before, there is no difference between version A and version B, and any positive result is a false positive.
The plot below shows the consequences of conducting multiple comparisons without the correct adjustments. With as few as five comparisons, the risk of observing a single false positive has increased from 5% to 20%. However, when the appropriate correction is implemented, the false positive rate is held constant at 5%.
Insignificant “Significant” Results: Large sample, small effect
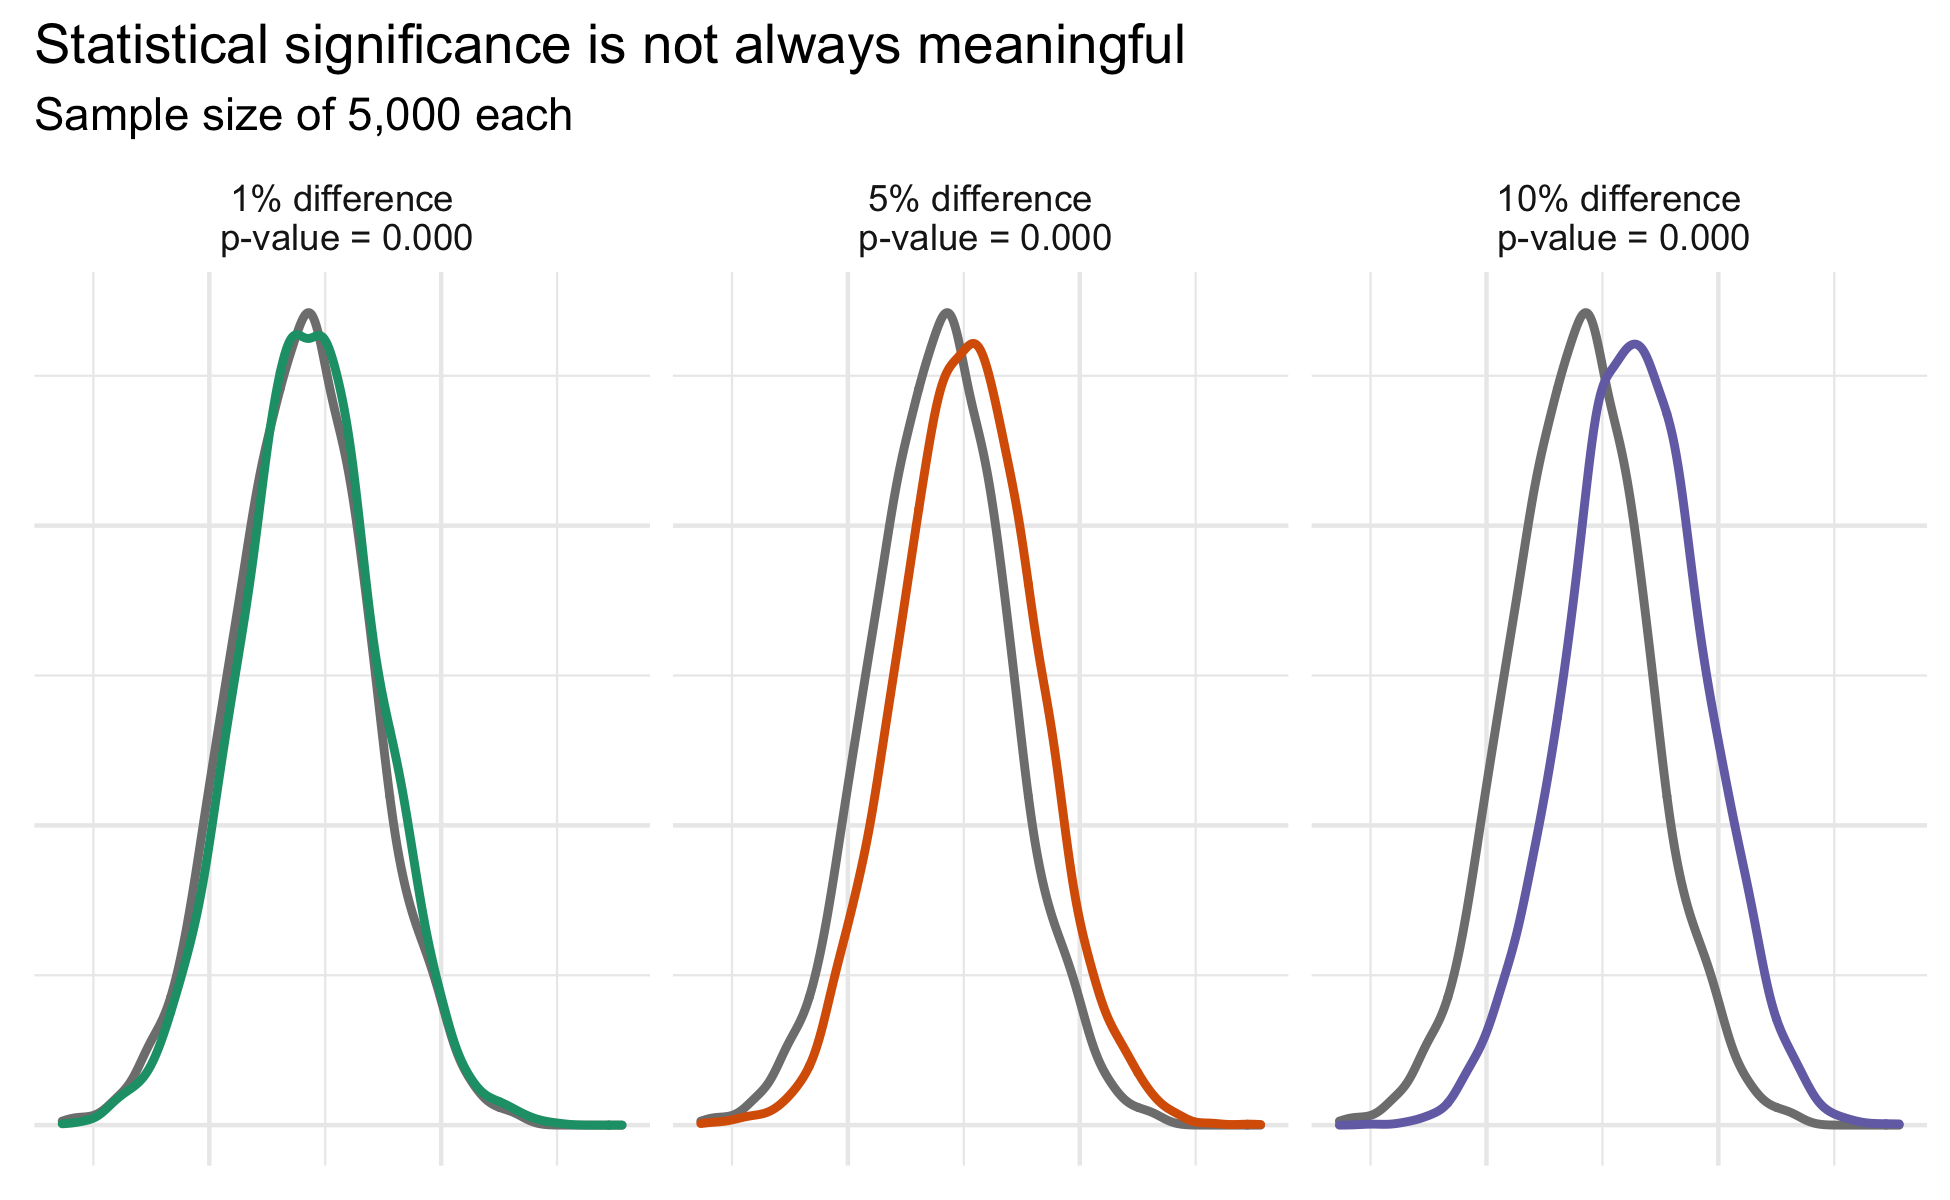
When sample size is sufficiently large, relying on statistical significance to determine the importance of an effect can be misleading. Statistical significance is necessary to demonstrate that there is a difference between conditions, but provides no information on the size of that difference. This is illustrated in the plot below that shows results of three difference A/B tests. Because the data was simulated, it is known that one test has a 1% difference between groups, one has a 5% difference between groups and the remaining test has a 10% difference between groups. All three tests are statistically significant and have indistinguishable p-values. This illustration visualizes the contrasts between statistical significance and effect size.
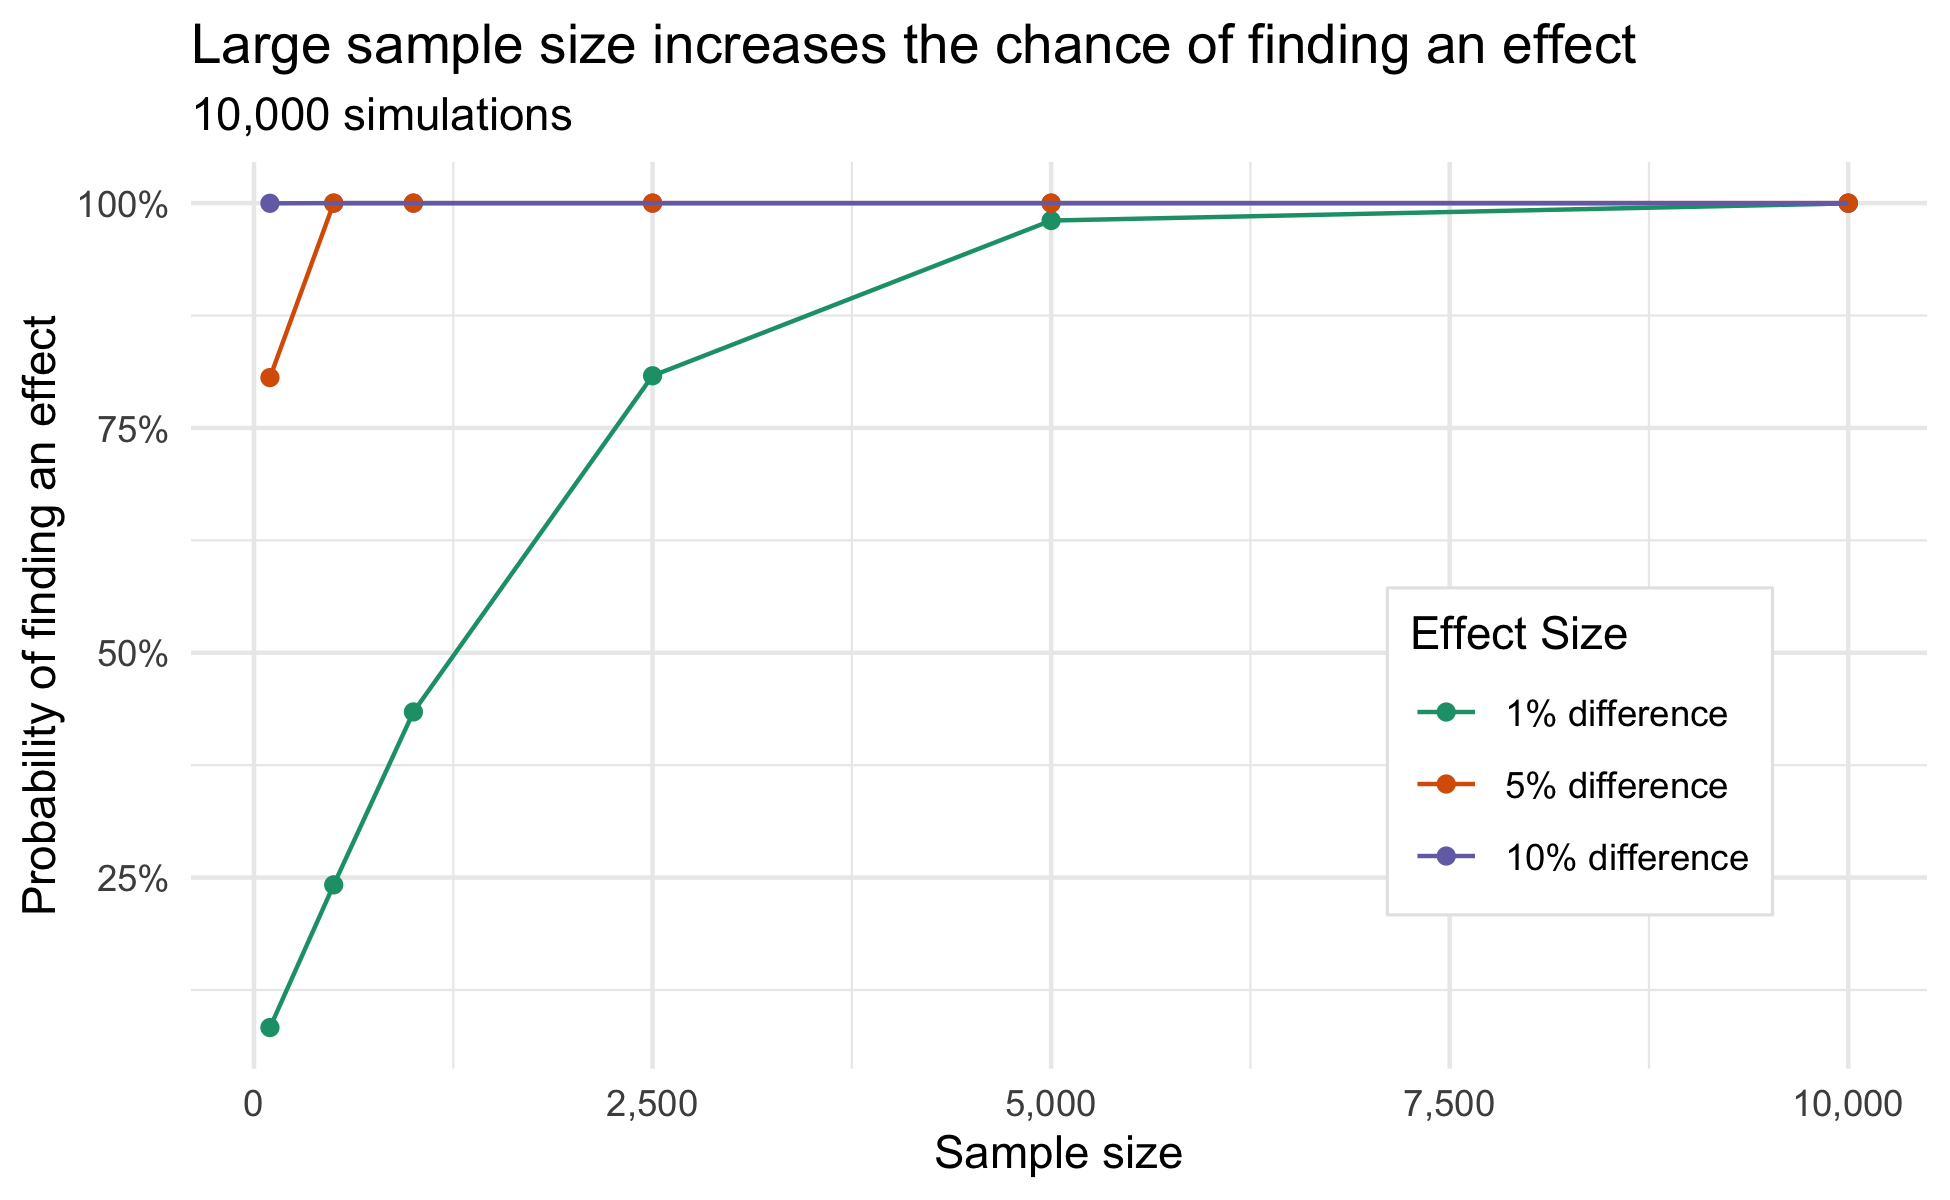
Statistical significance and effect size are difference constructs but there is an important relationship between them: as sample size increases increasingly small effects can be identified as statistically significant. This is illustrated by the results of the simulation study shown below. With a sample size of 5000 a 1% difference between two groups is consistently detected. When working with large samples, statistical significance can not be the only metric used to asses the results of an A/B test. Both statistical significance and effect size need to be considered.
The size of a meaningful effect is inherently subjective and varies between disciplines and contexts. In one case a 1% effect may justify any potential costs that come with scaling up a change discovered within the A/B test cycle. In other contexts, the costs associated with implementing a change may exceed the benefit of a 1% difference. While the threshold for a meaningful effect varies, the difference between p-values and effect size is consistent across all fields. When this distinction is ignored real but practically trivial differences can be misinterpreted.
Ignoring Interactions
Randomly assigning participants to interact with either version A or version B is what allows A/B tests to make causal conclusions. Randomization, however, is not enough to uncover potential hidden patters that may exist within the results of a test cycle. When data is not visualized an inspected before conducting an analysis it is possible to overlook nuanced results and reach wrong conclusions.
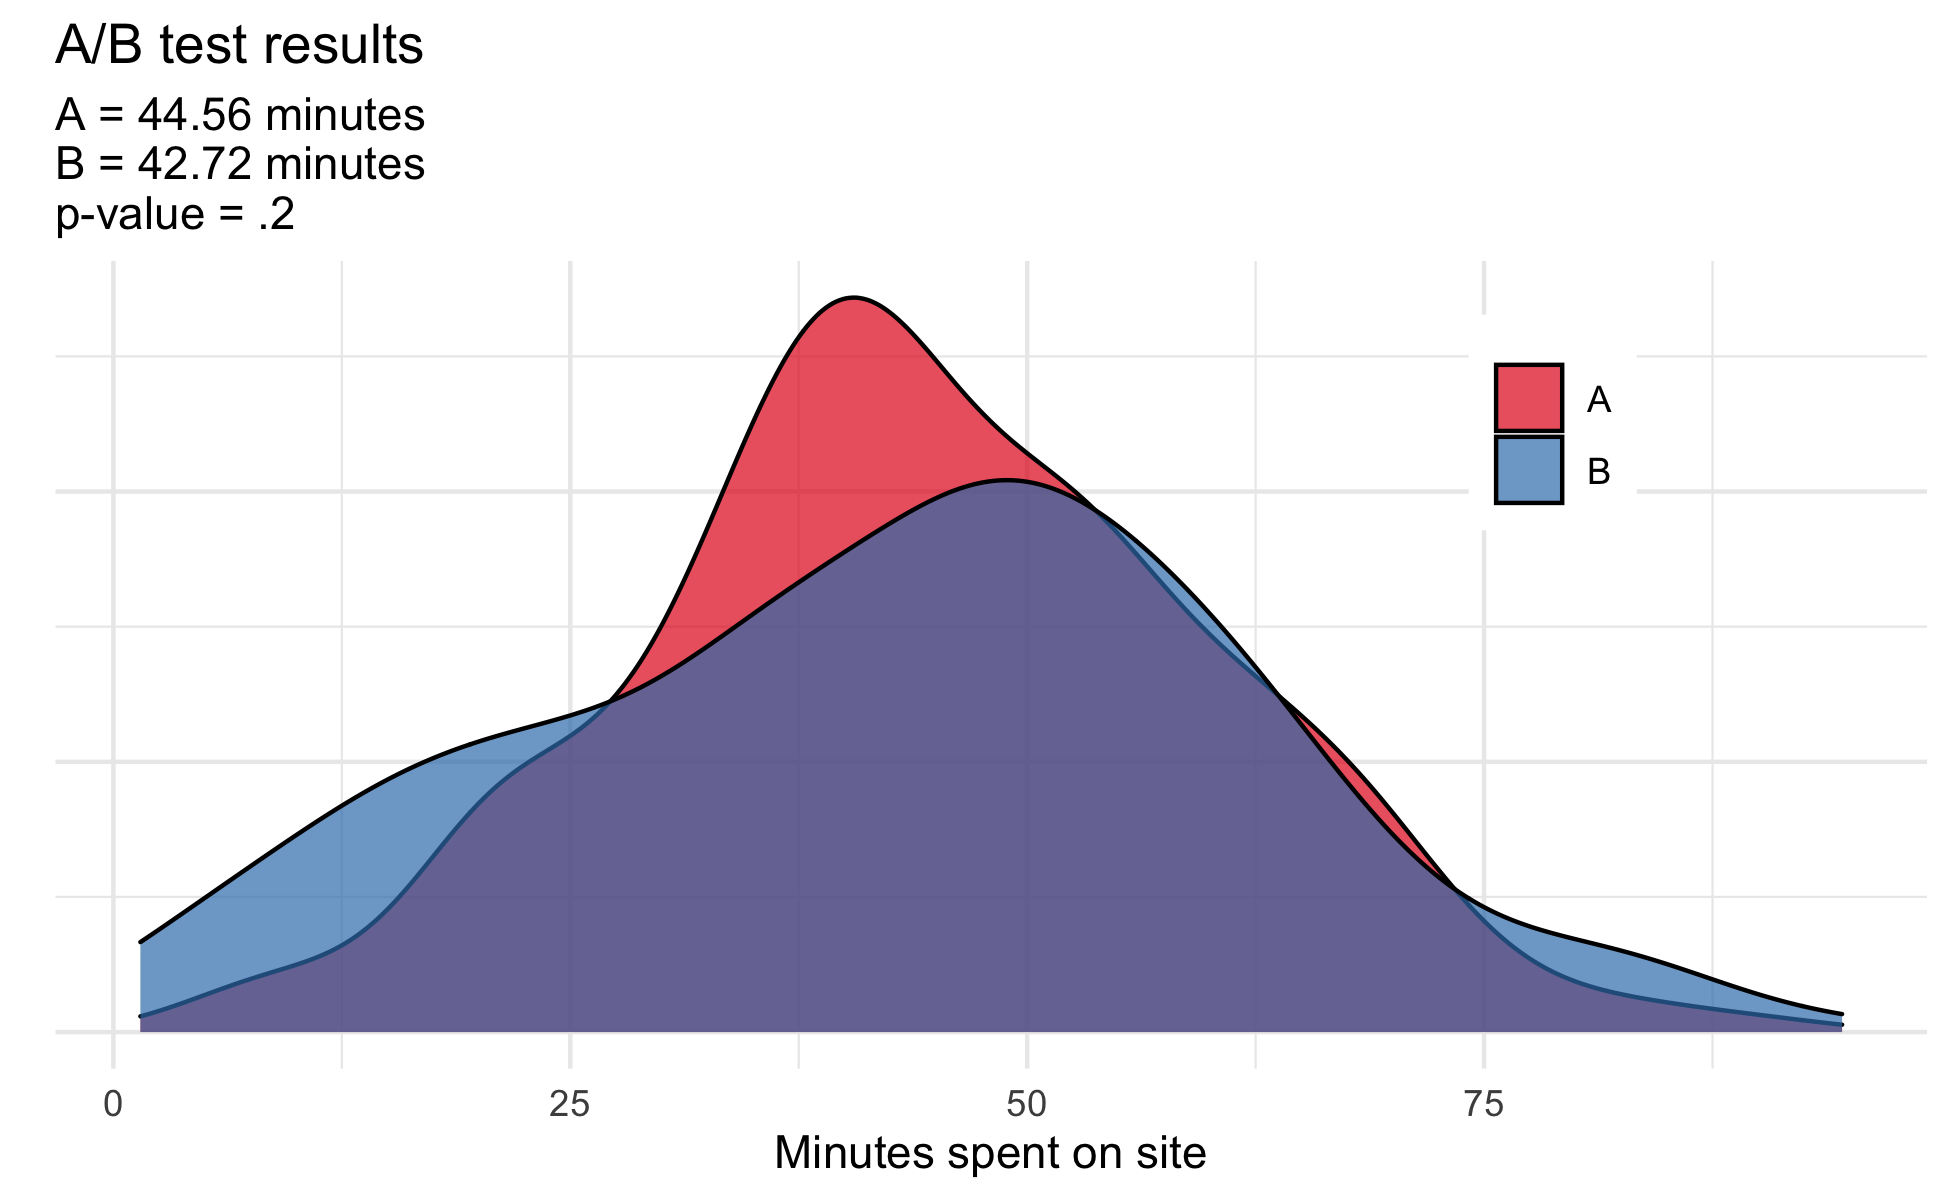
Imagine a digital news organization interested in comparing the effects of how changing its website impacts how many minutes users spend reading site content. Some readers use their computers while others primarily use their phones to visit the site. Due to randomization, the resulting A/B test has an equal number of computer and mobile users represented in group A and group B. Results from a simulated analysis of 500 users (250 per group) show there is no clear difference between conditions.
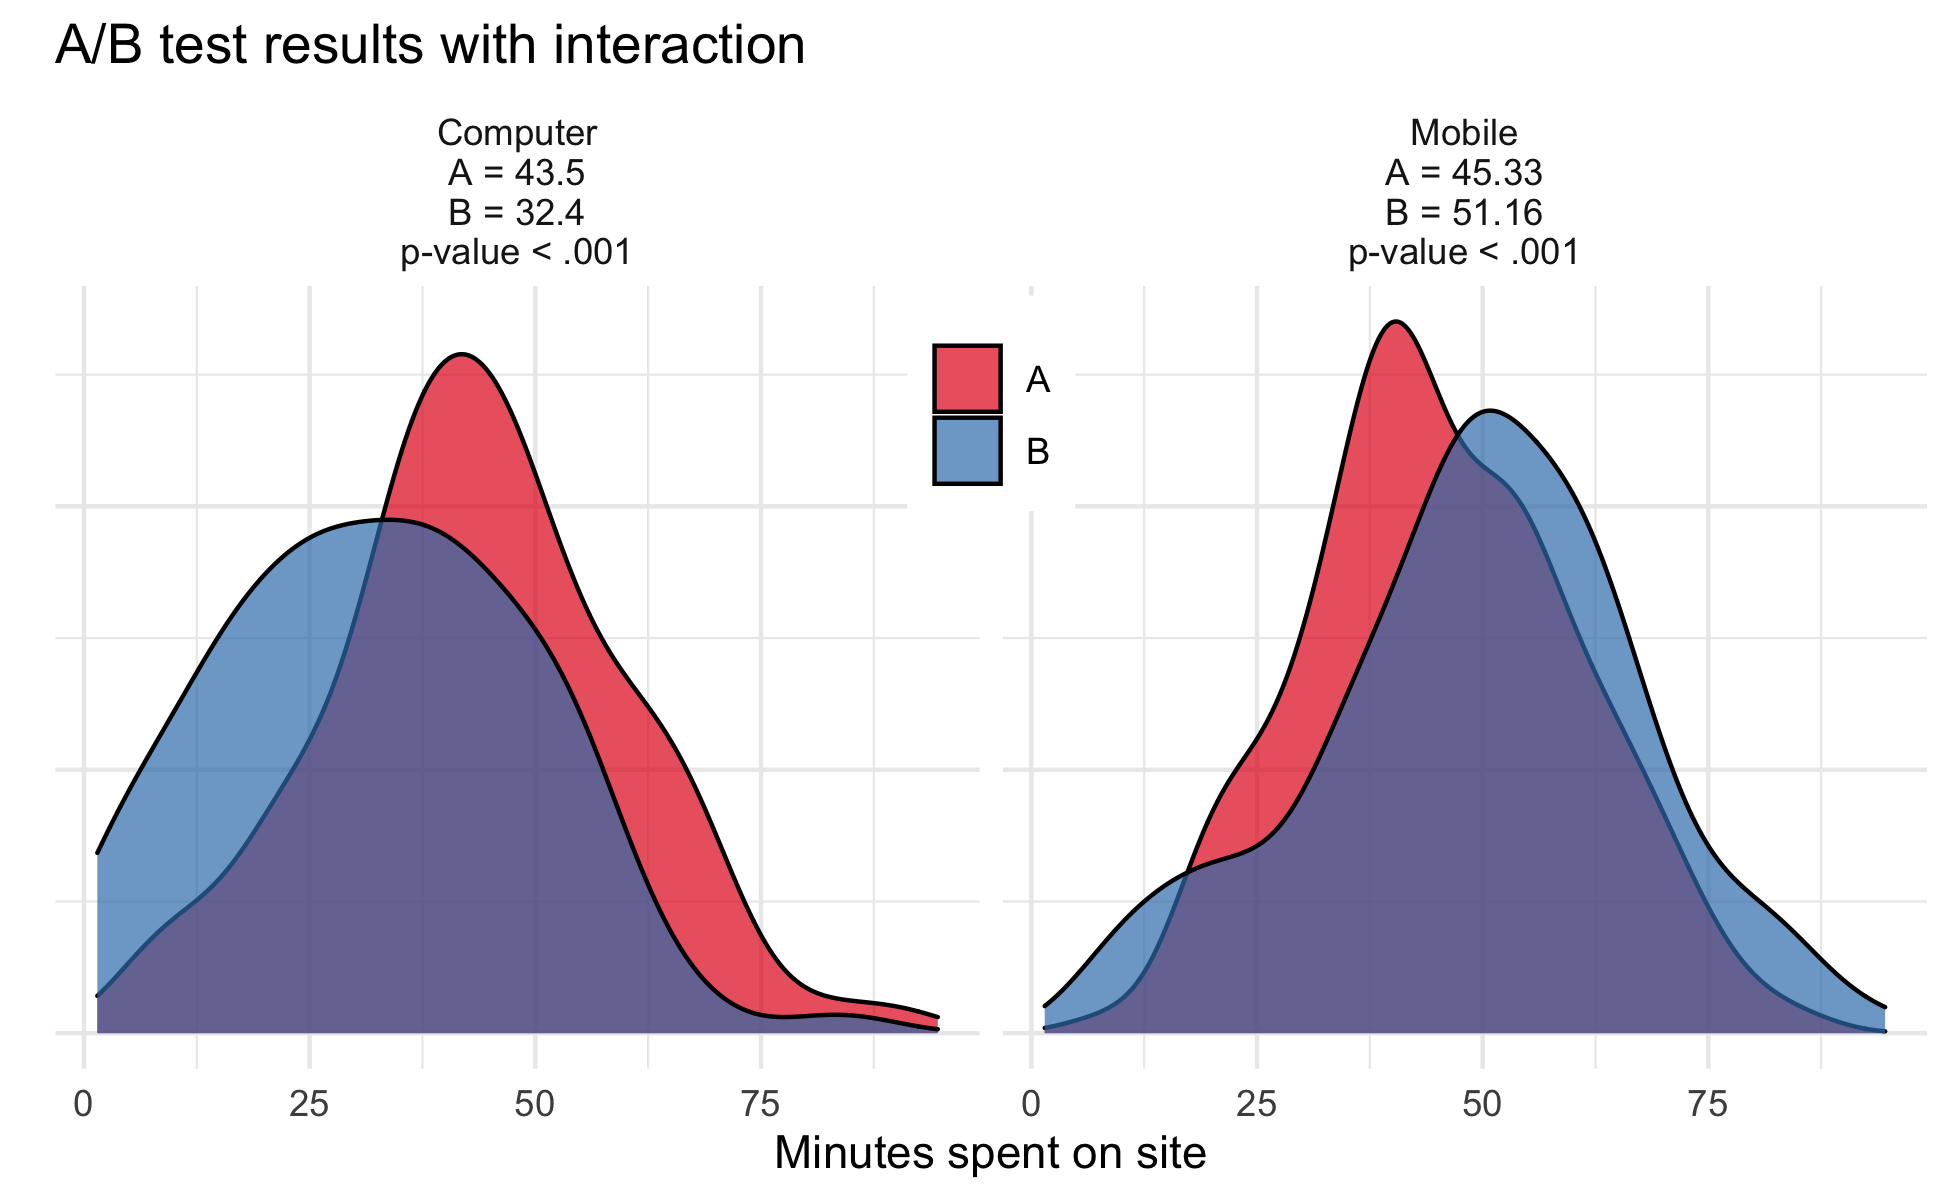
While the above test would be methodologically sound the potential interaction between mediums (either computer or mobile) and experimental group (version A or version B) was never compared. Visualizing and testing the possibility that phone users may have a different experience than computer users reveals a very different result: version B increased site usage for phone users but actively decreased use for computer users suggesting the need for a tailored strategy. When proper data exploration is not conducted and relevant interactions are ignored, important findings can be missed.
Conclusion
A/B testing is a powerful tool that is frequently praised for its simplicity and ease of analysis. A/B tests, however, are not always simple. Misguided conclusions can be made when optional stopping, multiple comparisons, effect size, and possible interactions are ignored.
In summary:
-
Frequently checking your data mid experiment (optional stoppage) and conducting multiple comparisons without correction drastically increases the rate of false positives.
-
Statistical significance and meaningful difference are not the same.
-
Hidden interactions within A/B tests need to be explored.
To see the completed code used to generate all simulations please refer to the analysis folder of the repository.